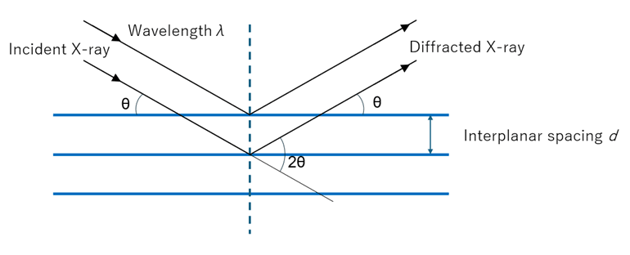
Diagram Showing the Basic Principle
Measurement Example
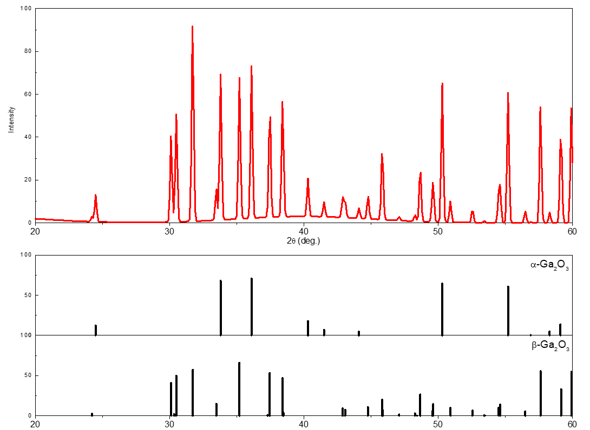
The left figure shows the XRD pattern of a mixed α-Ga2O3 and β-Ga2O3 crystal. The red curve represents the XRD profile of the mixed crystal.
The bar graph on the left shows the calculated 2θ values and intensities for each crystal phase. Peaks in the XRD profile are observed at the calculated 2θ values for each crystal phase.
Applications
・Crystallinity evaluation: Thin-film crystallinity
When a film is deposited on a crystalline substrate, the deposited crystals may grow as randomly oriented polycrystals, with only the out-of-plane direction aligned with the substrate, or with the same crystallographic orientation as the substrate.
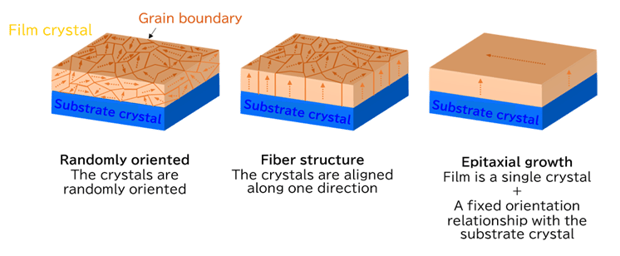
The appropriate measurement techniques for each purpose are as follows:
1) Crystal phase identification: Thin-film XRD
2) Crystal orientation: Pole figure measurement
3) Epitaxial film crystallinity: Rocking curve measurement